Sunday, June 21, 2015

17 Powerful Facebook Stats for Marketers and Advertisers


17 Powerful Facebook Stats for Marketers and Advertisers


17 powerful facebook stats


Every second there are 20,000 people on Facebook. That number alone makes it a valuable website for marketers, whether you’re promoting a service, releasing a product or conducting market research.


What began as a way for college students to connect has grown into one of the world’s largest social networks, and one of its greatest marketing resources, too. But in order to be successful on Facebook, you have to dig below the surface and familiarize yourself with the ins and outs of the platform.


Here are some important Facebook statistics—broken down by users, Pages, ads, geography and industry—to help guide your social media strategy.


Facebook User Stats


Before we dive into the really interesting Facebook stats, here are some important numbers you should be aware of. As of Q1 2015, Facebook has:


  • 1.44 billion monthly active users

  • 1.25 billion mobile users

  • 936 million daily active users

  • 798 million mobile daily active users


To put things in perspective, Facebook now has more active users than China’s entire population (estimated to be 1.40 billion).


For a more in-depth breakdown of Facebook user demographics—including age, gender, income and education—see our previous article, Social Media Demographics for Marketers.


In addition to those, here are a few other stats to keep in mind when creating your Facebook strategy.


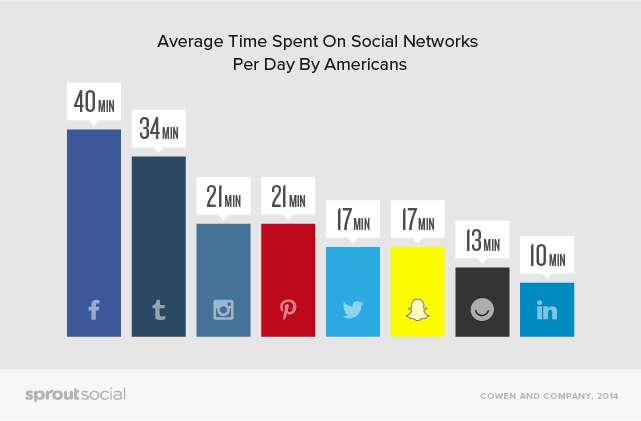
The Average American Spends 40 Minutes Per Day on Facebook.


When you consider how much time Americans spend engaging with digital media–nine hours a day—40 minutes on Facebook might not seem like a lot of time. But let’s compare that to the amount of time spent on other social platforms.


  • Tumblr—34 minutes

  • Instagram—21 minutes

  • Pinterest—20.8 minutes

  • Twitter—17 minutes

  • Snapchat—17 minutes

  • Ello—13 minutes

  • LinkedIn—9.8 minutes


average time spent on social networks


In terms of capturing your target audience’s attention, Facebook presents a great opportunity since you have a larger window of time to work within. That said, people share 1.3 million pieces of content on Facebook every minute of every day so yours had better stand out. Make sure you’re up to date on the latest tips and tricks to help reach your audience.


Younger Facebook Users Have Significantly Larger Networks Than Older Users


According to data from Pew Research, 27% of adults 18-29 years old have more than 500 friends in their network, while only 15% of 30-49 year olds do.


An individual’s network can be just as valuable to your business as the individual. Networks are created around similar interests, and word-of-mouth referrals are valued more than ever before. If someone is talking about your brand or interacting with your Facebook Page, that activity will be displayed to their connections, effectively extending your reach.


24% of Non-Adopters Use Someone Else’s Facebook Account


Something else to consider: you’re not always reaching the person you think you are. Slightly more than half of people without Facebook live with someone who has an account. This is important because 24% of those non-adopters look at photos or updates on that person’s account.


With the unpredictability of the News Feed, it’s hard to say whether the creator of that account will see your post once the non-adopter scrolls past without engaging. For this reason, and many others, use Facebook’s feature set to your advantage instead of relying on a single status to get your message across.


Facebook Mobile Stats


Although Facebook lacked a strong mobile component as little as two years ago there are now, on average, 486,183 people accessing the social network from their mobile device every minute. As you build and refine your Facebook marketing strategy, be sure to keep these mobile users in mind.


75% of Facebook Video Views Occur on Mobile Devices


Consumers are watching and uploading videos to Facebook more than ever before. According to Mark Zuckerberg, the social network’s users view more than four billion videos a day—that’s up from just one billion in September 2014. Sheryl Sandberg went on to say that now 75% of those video views occur on mobile devices.


As a business, you must be sure that your company’s assets are mobile friendly. Some of those viewers will visit your website or product page after watching your video, and they’ll do so from their mobile device. It could have a major impact on your sales if your site doesn’t display or function properly.


Two-thirds of smartphone users said that a mobile-friendly site made them more likely to buy a company’s product or service, according to a survey conducted by market research firms Sterling Research and SmithGeiger. Half of respondents went on to say that even if they like a business, they’ll use its site less often if it doesn’t work well on their smartphone.


581 Million Facebook Members Are ‘Mobile Only’


facebook mobile only user stats


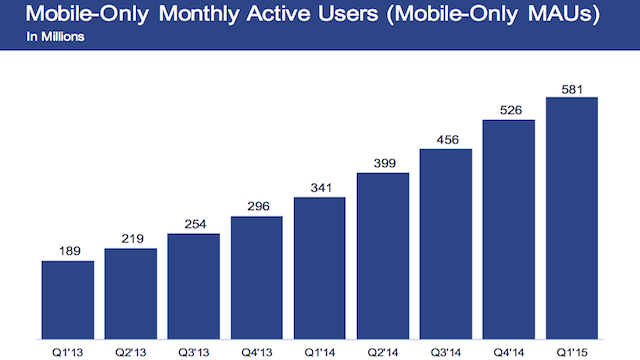
Of the 1.44 billion people who use Facebook each month, 581 million only log in using their mobile devices. That means whether they’re commenting on a Page post or watching a video, they’re only doing so from mobile. If your call-to-action works and they go on to read more about your company’s backstory or make a purchase, then that process had better be compatible with their device.


It also means that advertisers can have even more precise targeting for Facebook’s Mobile App Ads. With targeting around specific devices and operating systems, you can now deliver ads to people specifically using an iPhone 5S with a minimum OS version of 7.0 who are on Wi-Fi, for example.


Facebook Page Stats


Your Facebook Page is the heart of your presence on the social network. How you approach it can mean the difference between an engaged community of fans or an audience of one, which unfortunately would be you. In 2014, Facebook revealed that there are 40 million active small business Pages. Don’t let your message fall on deaf ears; use these stats to rise above the noise.


49% of Consumers Like a Facebook Page to Support the Brand


When it comes to crafting content for your Facebook Page, it’s helpful to know why people are there in the first place. If you can understand what it is they’re hoping to get out of a Like, then you can deliver the most relevant and appealing content in order strengthen your relationship with those individuals.


stats for becoming a brand fan on facebook


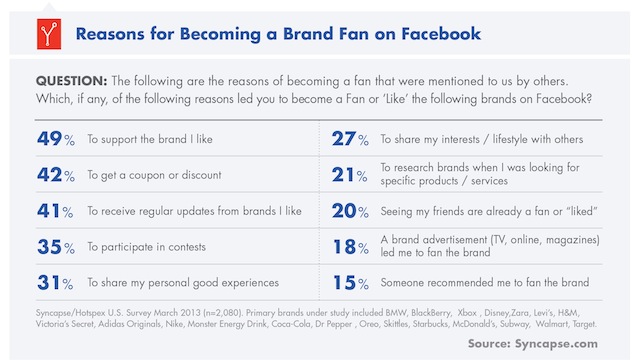
According to a 2013 study from Syncapse, the most popular reason why people Like a Facebook Page is to support the brand. This is notable because it means that some people are willing to align themselves with businesses and endorse their products without any kind of financial incentive. These are the people you want to identify when looking for brand ambassadors.


40% of Consumers Don’t Like Brands At All


Being active on Facebook and engaging with branded content aren’t mutually exclusive, however. In this 2014 study, Kentico asked people how many brands they Like on the social network. Here are their responses:


  • 39% said 1-10 Pages

  • 7% said 11-20 Pages

  • 6% said 21-30 Pages

  • 40% said they don’t Like Pages at all


Trying to reach the 40% of people who don’t Like Pages is challenging, but not impossible. Your Page posts won’t reach them, but your Facebook Ads might.


The 1-10 group appears to be more selective in which Pages they align themselves with. This is an audience that you want to connect with. Not only do they put thought into which brands they engage with, but they probably favor loyalty over one-time-only interactions.


Video Posts Average 62% More Engagement Than Photos


facebook stats for post types


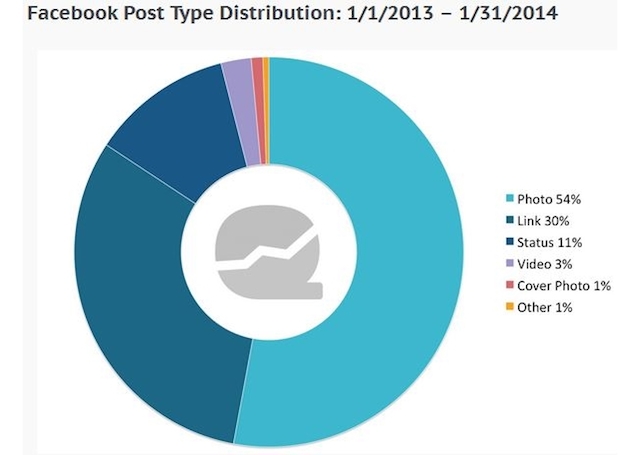
Research by Quintly found that photos were the most common type of content posted by Facebook Pages, accounting for 54% of posts worldwide. But while photos continue to generate strong engagement, videos return significantly higher numbers.


The company analyzed 72,194 Facebook Pages over the course of a month and found that videos averaged 2,183 interactions, compared with 1,358 for photos—that’s a 62% increase. At the time of the study, videos only accounted for a 3% share of the total content amount.


While that percent has likely grown with time, and there’s more video to compete with today than a year ago, a well-crafted piece of content can go a long way. Experiment with different themes and lengths of time to find the sweet spot for your audience.


Posting 1-2 Times Per Day Yields More Engagement


It might seem counterintuitive, but posting less frequently can actually help your engagement. Not surprisingly, it’s quality not quantity that helps you get ahead on Facebook. Research shows that brands that post just once or twice a day get 73% more comments and 32% more Likes than those who post three or more times.


This can help you to be more strategic with your content strategy. Rather than posting for the sake of populating your Timeline, plan your updates around milestones, product launches or initiatives from other departments (such as sales, human resources or customer support).


Facebook Advertising Stats


One thing that has definitely been on the rise recently is the importance of ad managers. Facebook is first and foremost a social network, but marketing and advertising are becoming much more intertwined than ever before. Now it’s not enough to do just one or the other; your campaigns have to seamlessly blend together for maximized effect.


Facebook Ad Prices Have Increased By 247%


Due to higher quality, Facebook reported during its Q3 2014 earnings call that price per Facebook Ad has increased 247%. Businesses, especially the 40 million small businesses using the platform, need to have a much better understanding of who their target audience is in order to generate a better return on investment from their ads. It’s no longer cost effective to throw together an ad and cast it out using the widest net. You really have to dive into your audience segments and tailor your ads to best meet their interests.


The Overall Click-through Rate Lift From Using a Call-to-Action Button Is 2.85x


Great for business objectives, call-to-action (CTA) buttons help your audience clearly understand the action you want them to take after viewing your Facebook Ad. Currently you’re able to choose from the following:


  • Shop Now

  • Book Now

  • Learn More

  • Sign Up

  • Download


After a one-month review of AdRoll advertisers’ running Facebook campaigns with CTA buttons, the company found that those ads experienced a 2.85x higher click-through rate compared to ads that didn’t have a CTA.


facebook cta button stats


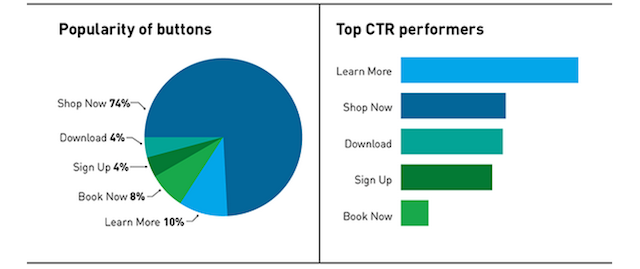
As you can see, 74% of advertisers preferred the “Shop Now” button, while only 10% preferred “Learn More,” which outshined the former in terms of performance.


Adding a CTA to your News Feed ad doesn’t cost extra, so be sure to consider the option when creating your next ad.


Click-through Rates Are Higher for Custom Audiences Than Facebook Exchange


According to research from Kinetic Social, click-through rates for Website Custom Audiences (WCA) were outperforming those on Facebook Exchange (FBX). In December 2014, the average CTR for U.S. retargeted display ads run on WCA was 1.25% compared to 0.12% on FBX.


It’s worth noting that this isn’t exactly a fair comparison; FBX ads are desktop-only while WCA placements support desktop and mobile. That said, eMarketer expects mobile to account for 61.5% of time spent on Facebook per day by U.S. adults this year, so choosing an option that supports mobile is in your best interest.


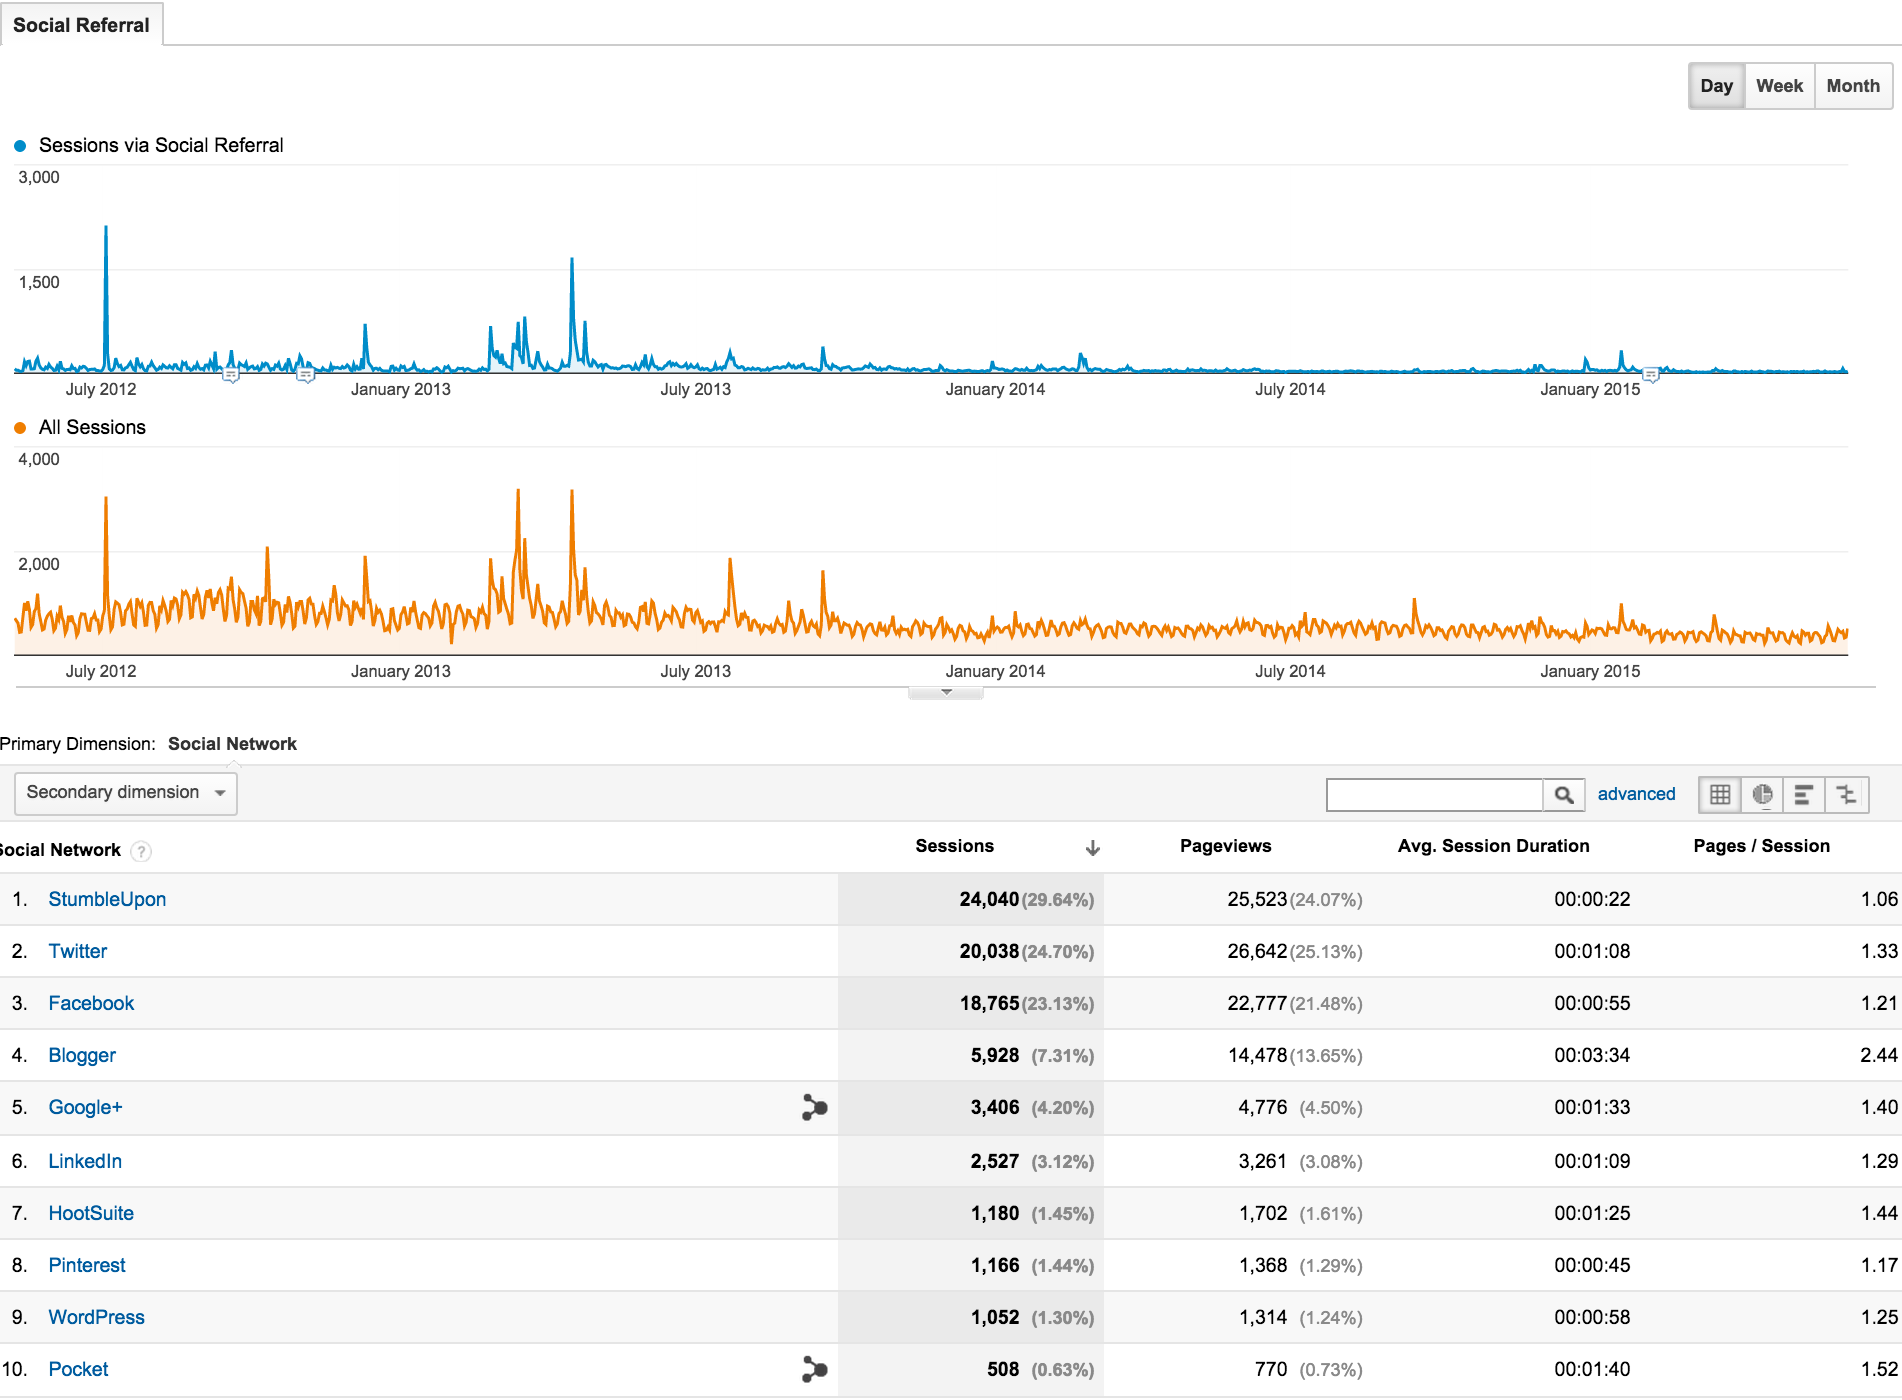
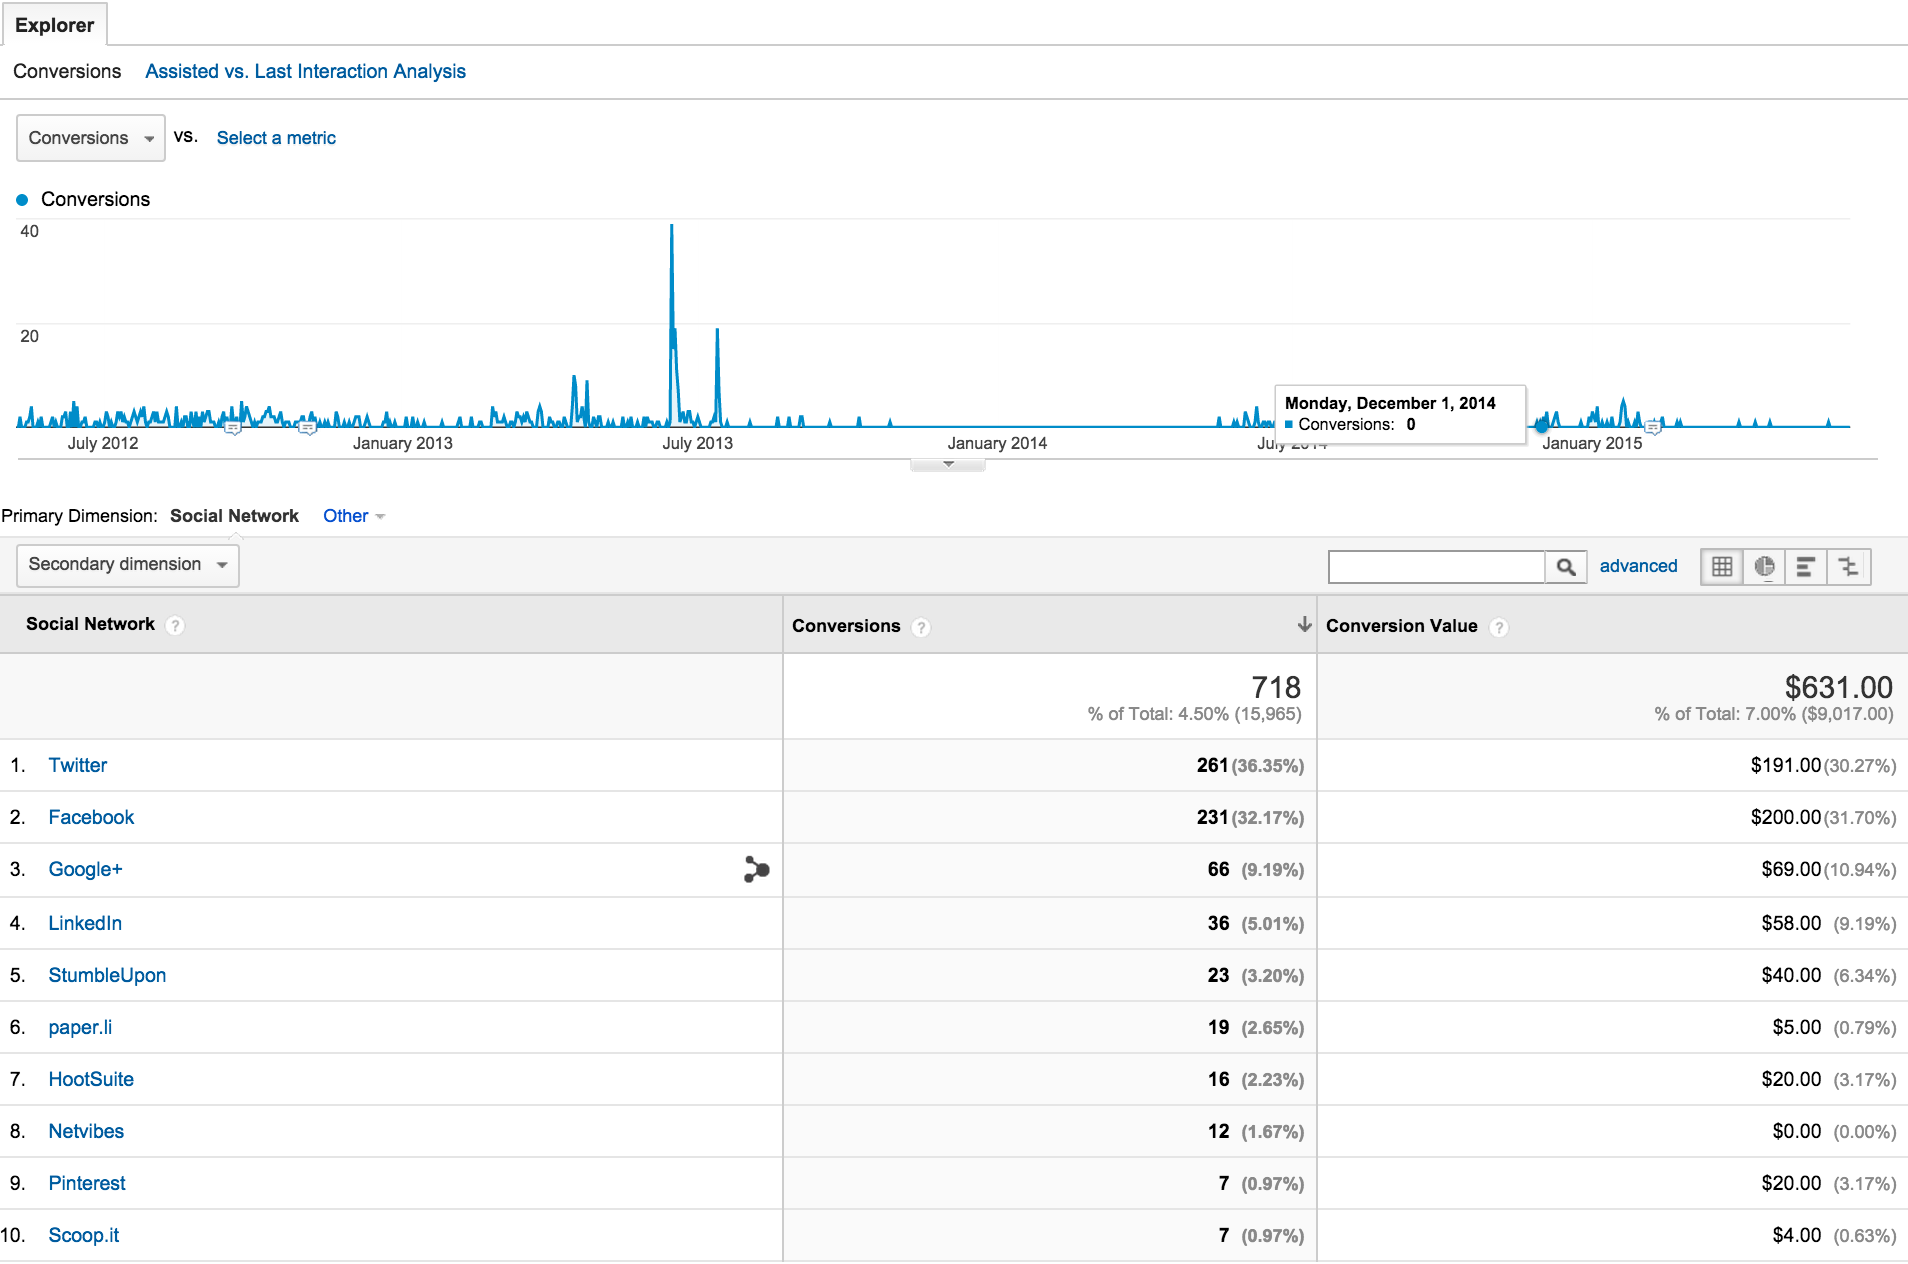
Facebook Drives Almost 25% of All Social Referral Traffic


shareaholic facebook referral stats


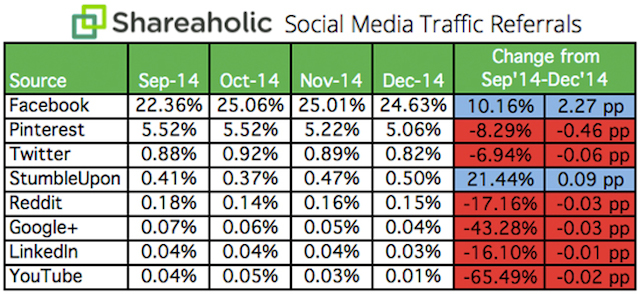
Facebook is the clear leader in social referral traffic, driving almost 25% of all referral traffic. The social network’s total share of visits to Shareaholic’s network was 24.64% in December 2014, far above Pinterest which came in second place at 5.06%. In fact, according to Shareaholic’s data, Facebook drives more referral traffic than Pinterest, Twitter, StumbleUpon, Reddit, Google+, LinkedIn and YouTube combined.


Of course, not all of these referrals are paid—it’s likely a mix of organic and paid with views coming from both Pages and Facebook Ads. When you consider the audience size of these Pages, this metric really speaks to their ability to target highly relevant content to people who are the most interested in it. If everyone could tap into that segmentation power, we imagine that this stat would be much higher.


Facebook Geo Stats


Aside from its size, what makes Facebook so attractive to marketers is its reach—you can deliver messages to the neighbors down the street from your shop, or across the ocean.


More Than 70 Translations Are Available


In order to support its global audience, Facebook has more than 70 languages available thanks to a framework that lets community members translate text on the platform. At this time, more than 300,000 people have contributed translations for different languages and dialects.


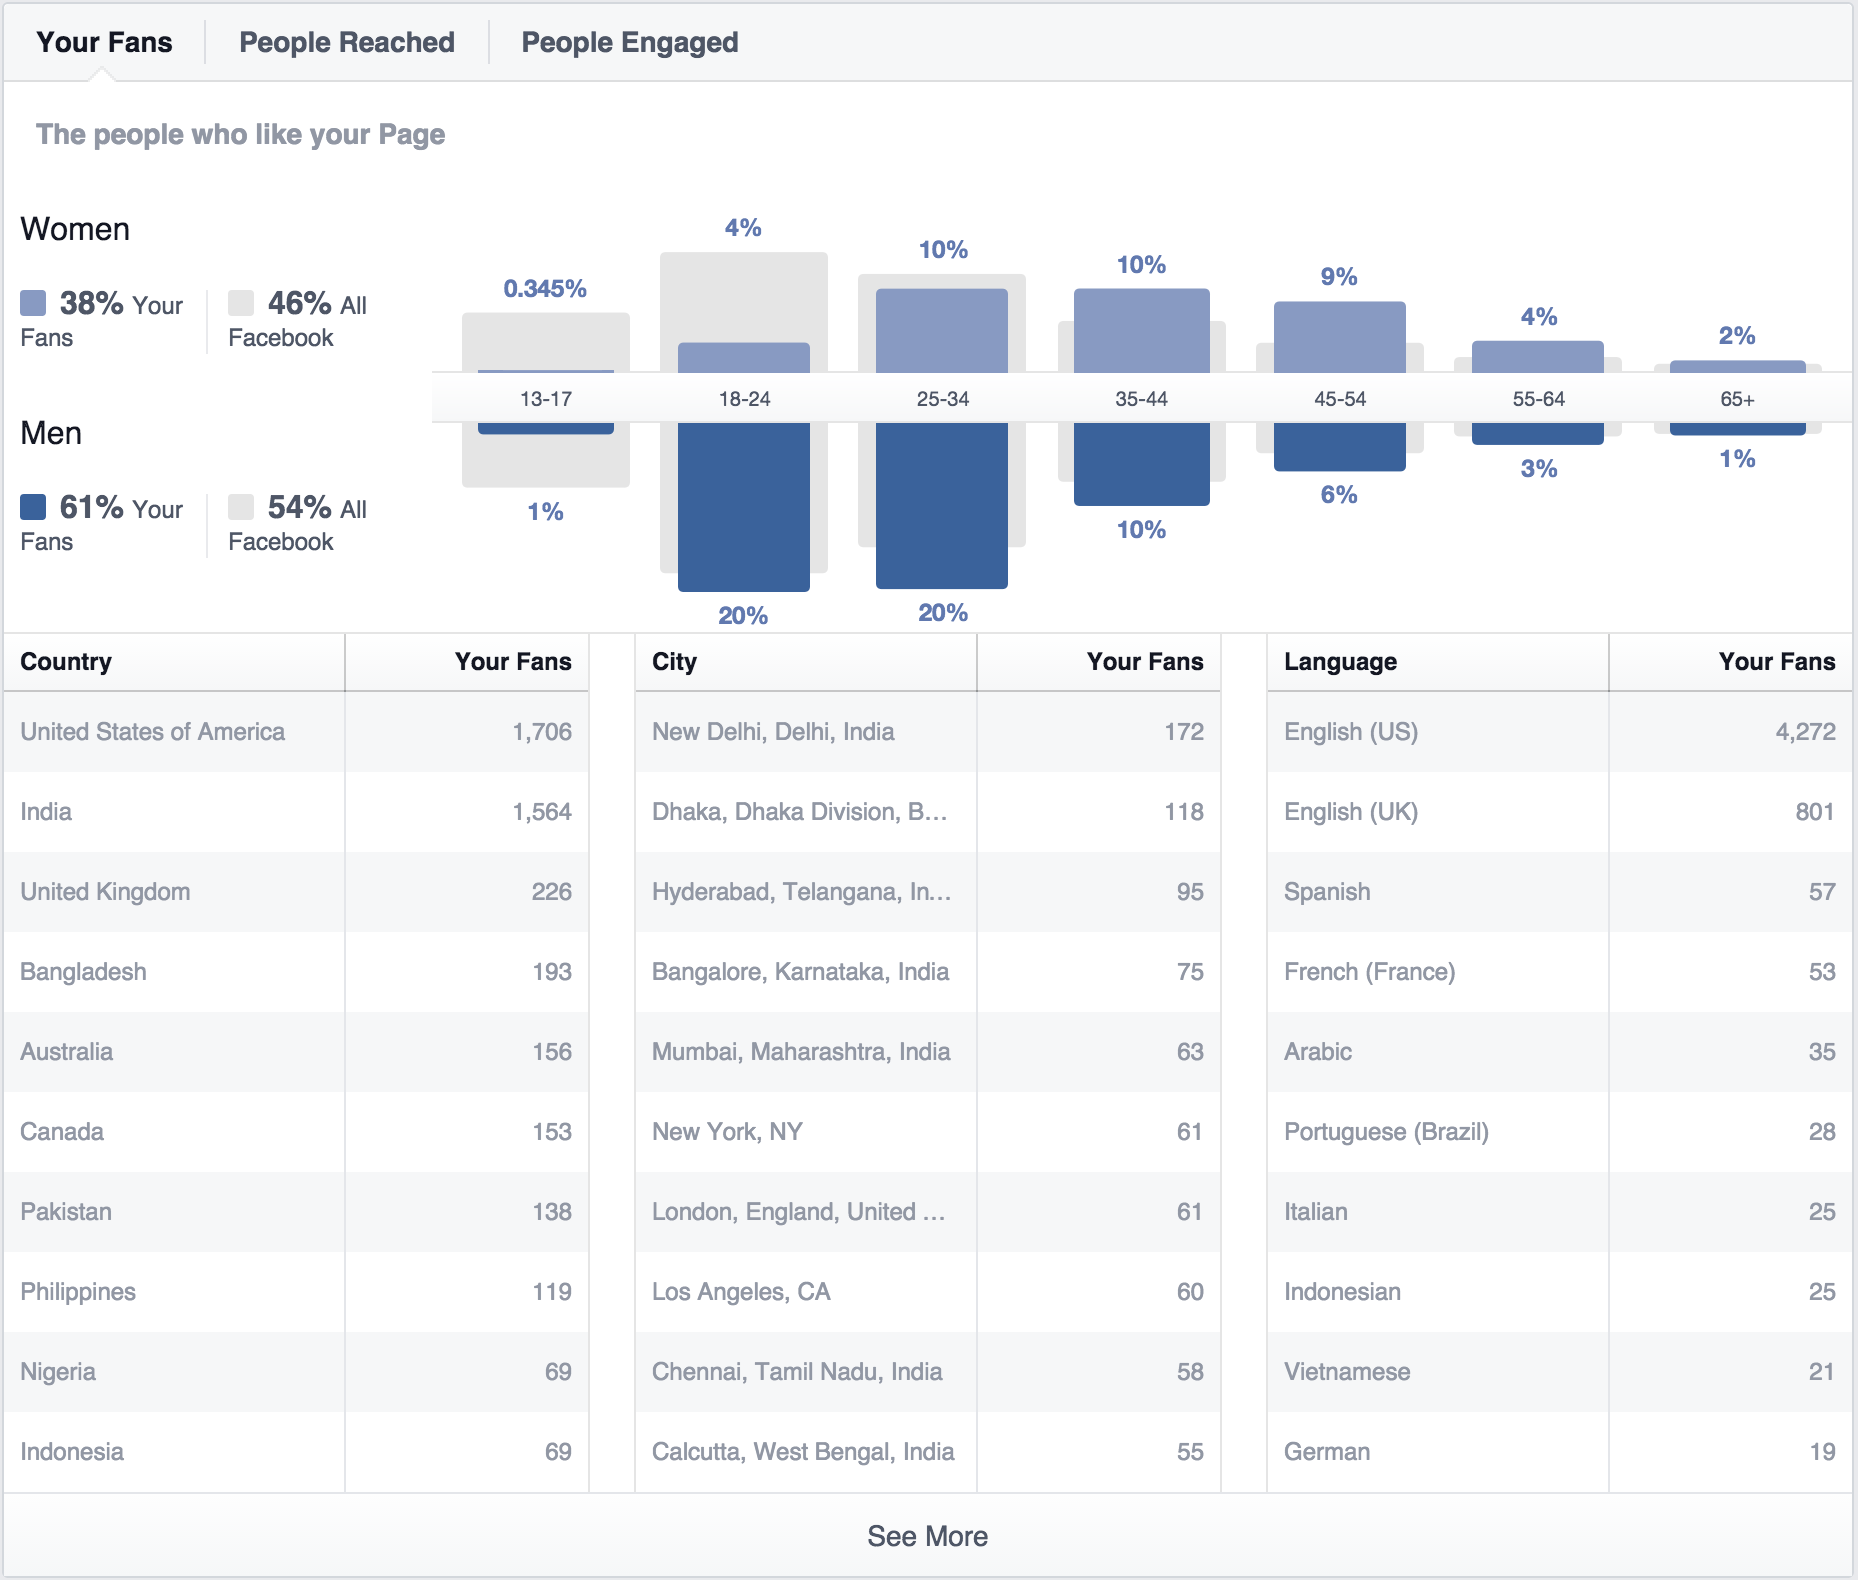
Global brands need to take this into consideration. Use analytics to help you understand the demographics of your audience, and keep an eye out for where large fan bases live. From there you can target your Page posts by location or language.


For example, if you limit the language of your post’s audience to Spanish, only people who have Spanish set as their language on Facebook or list Spanish as one of their languages on their profile will be able to see your post on your Page as well as in News Feed and search.


The U.S. and Canada Are Only a Small Subset of Facebook’s Global Reach


facebook monthly active user stats


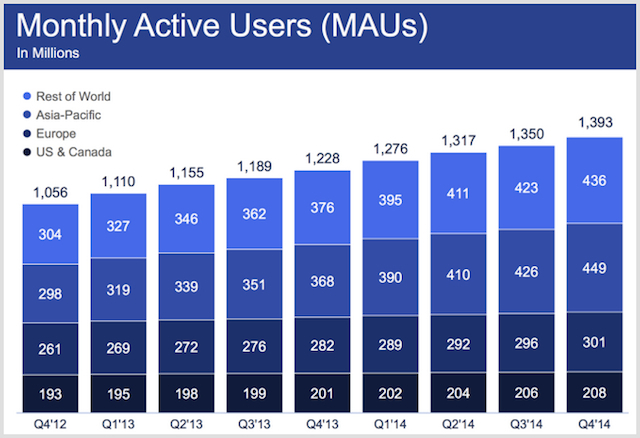
Facebook’s 1.44 billion users are spread around the world. Of those, only 208 million monthly active users are located within North America—according to data from Q4 2014. Europe has another 301 million, while Asia Pacific tops the bill with 449 million. The rest of the world accounts for approximately 436 million.


Facebook itself has revealed that 82.8% of its daily active users are outside of the U.S. and Canada. This just reconfirms that global brands need to think more strategically about their content—a one-size-fits-all kind of approach won’t be successful. If you have an international presence, your social media managers need to be well versed in a range of languages, dialects, time differences and cultures.


Facebook Industry Stats


Another appealing feature of Facebook is its diversity among businesses. Not only can you reach a remarkably varied group of people, but businesses across industries can participate. From the glitz and glamour of the entertainment industry to hyper-focused utilities, there’s something here for everyone.


Media and Entertainment Brands Receive the Most Engagement


facebook engagement rate stats by industry


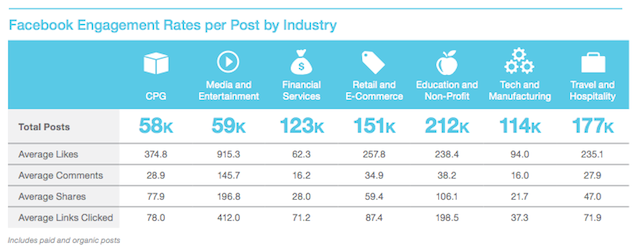
Salesforce tracked more than 2.4 million Facebook posts and found that the media and entertainment industry posts received the most Likes, comments, shares and links clicked. On average, this industry received:


  • 915.3 Likes

  • 145.7 comments

  • 196.8 shares

  • 412.0 links clicked


While it could be difficult to recreate those numbers—in terms of comments, the second-place industry didn’t even come close—it’s a good reminder to share the kind of content that your audience wants. Pay close attention to the information provided by Insights to see what post types your fans are engaging with the most, and tailor your content appropriately moving forward.


Engagement is 29% Higher on Sundays For the Finance Industry


One of the greatest challenges is determining the best time to publish content on any social network. While there’s no surefire formula, a 2013 infographic fromLinchpinSEO could shed some light on the conundrum.


According to the infographic, the best day for financial brands to post to Facebook is Sunday. This might seem counterintuitive since most banks aren’t open on Sundays, but that doesn’t mean your customers aren’t online. If your social media manager isn’t available, rely on a social media management tool to schedule your posts.


Most of the industries included in the infographic saw high engagement rates on weekends. The technology industry, however, is one of the few that received higher engagement during the week. In fact, for technology brands, engagement is 30% higher than average on Mondays. Don’t let a case of the Mondays stop you from interacting with your customers.


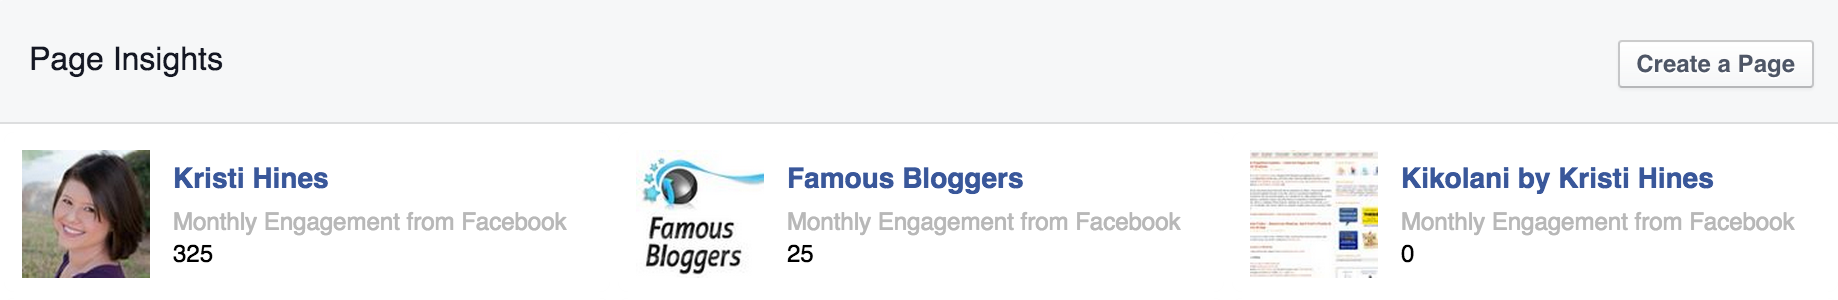
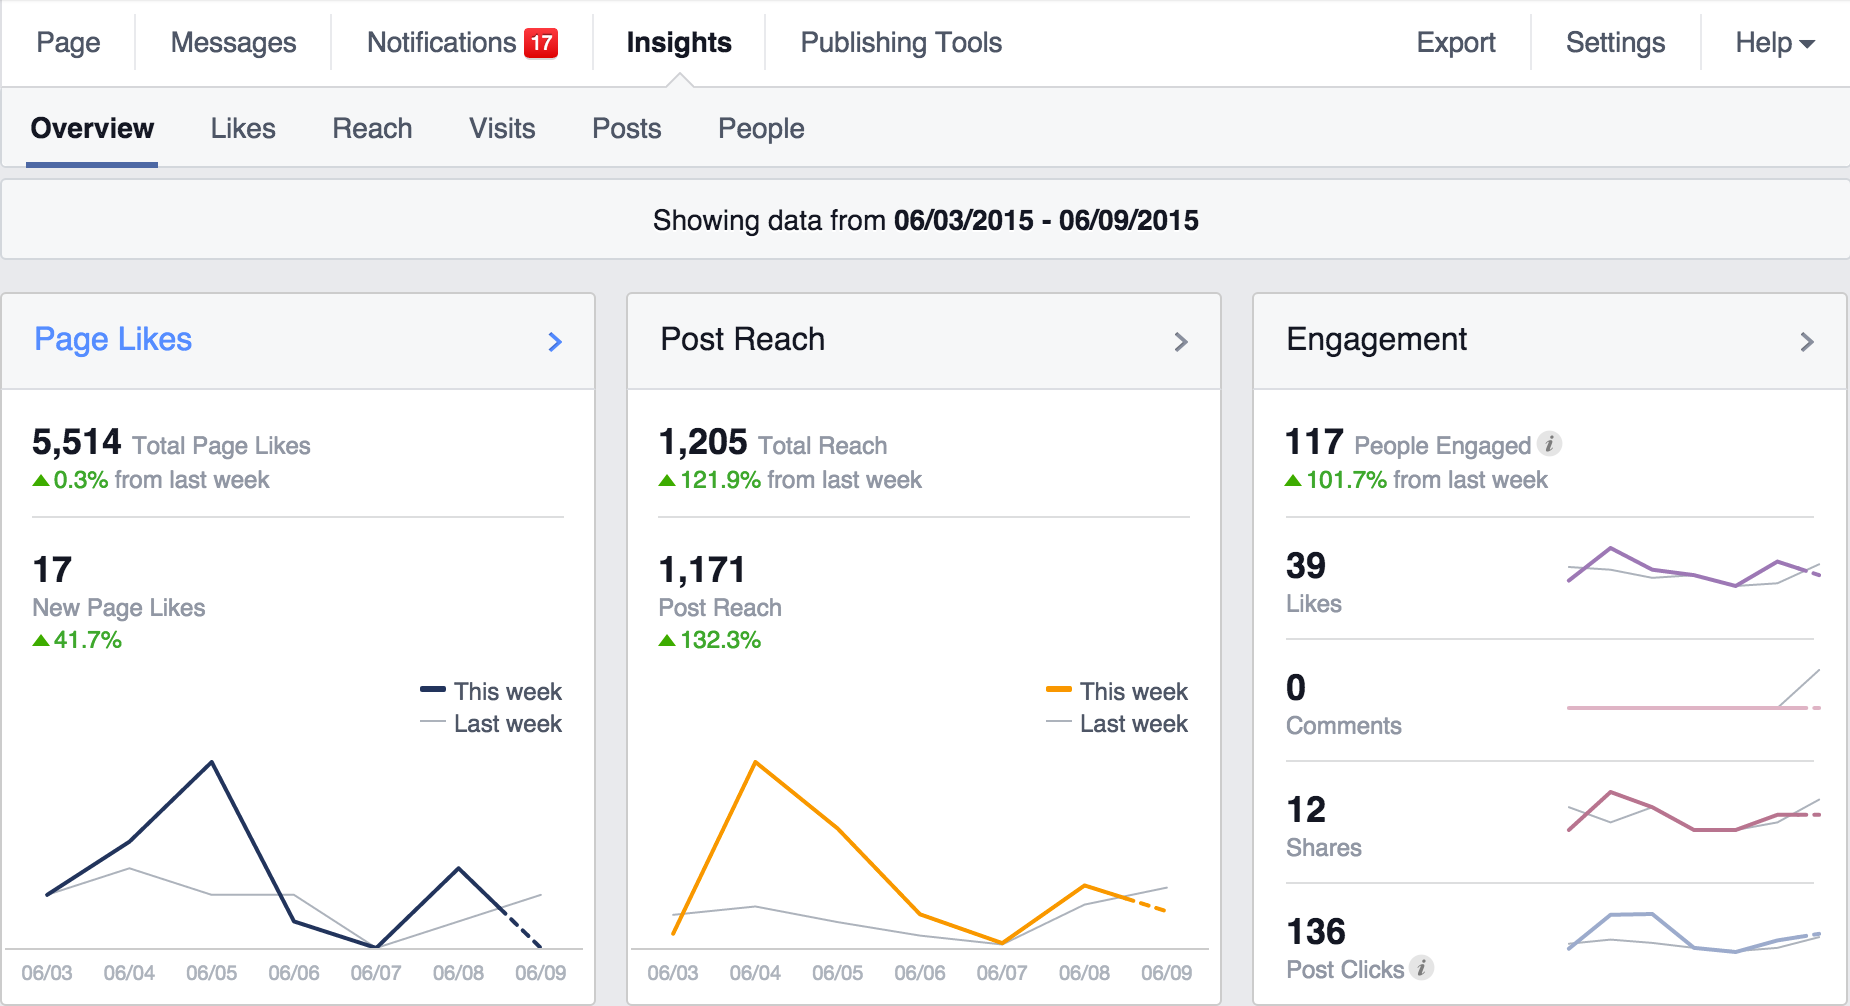
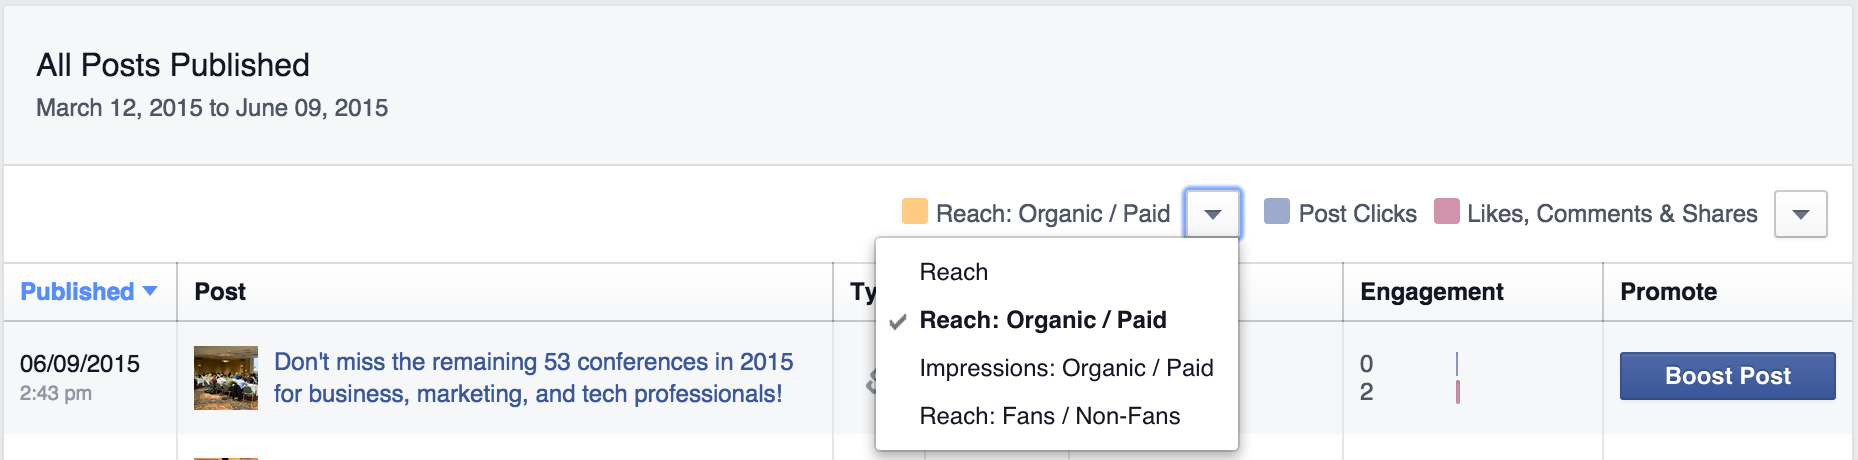
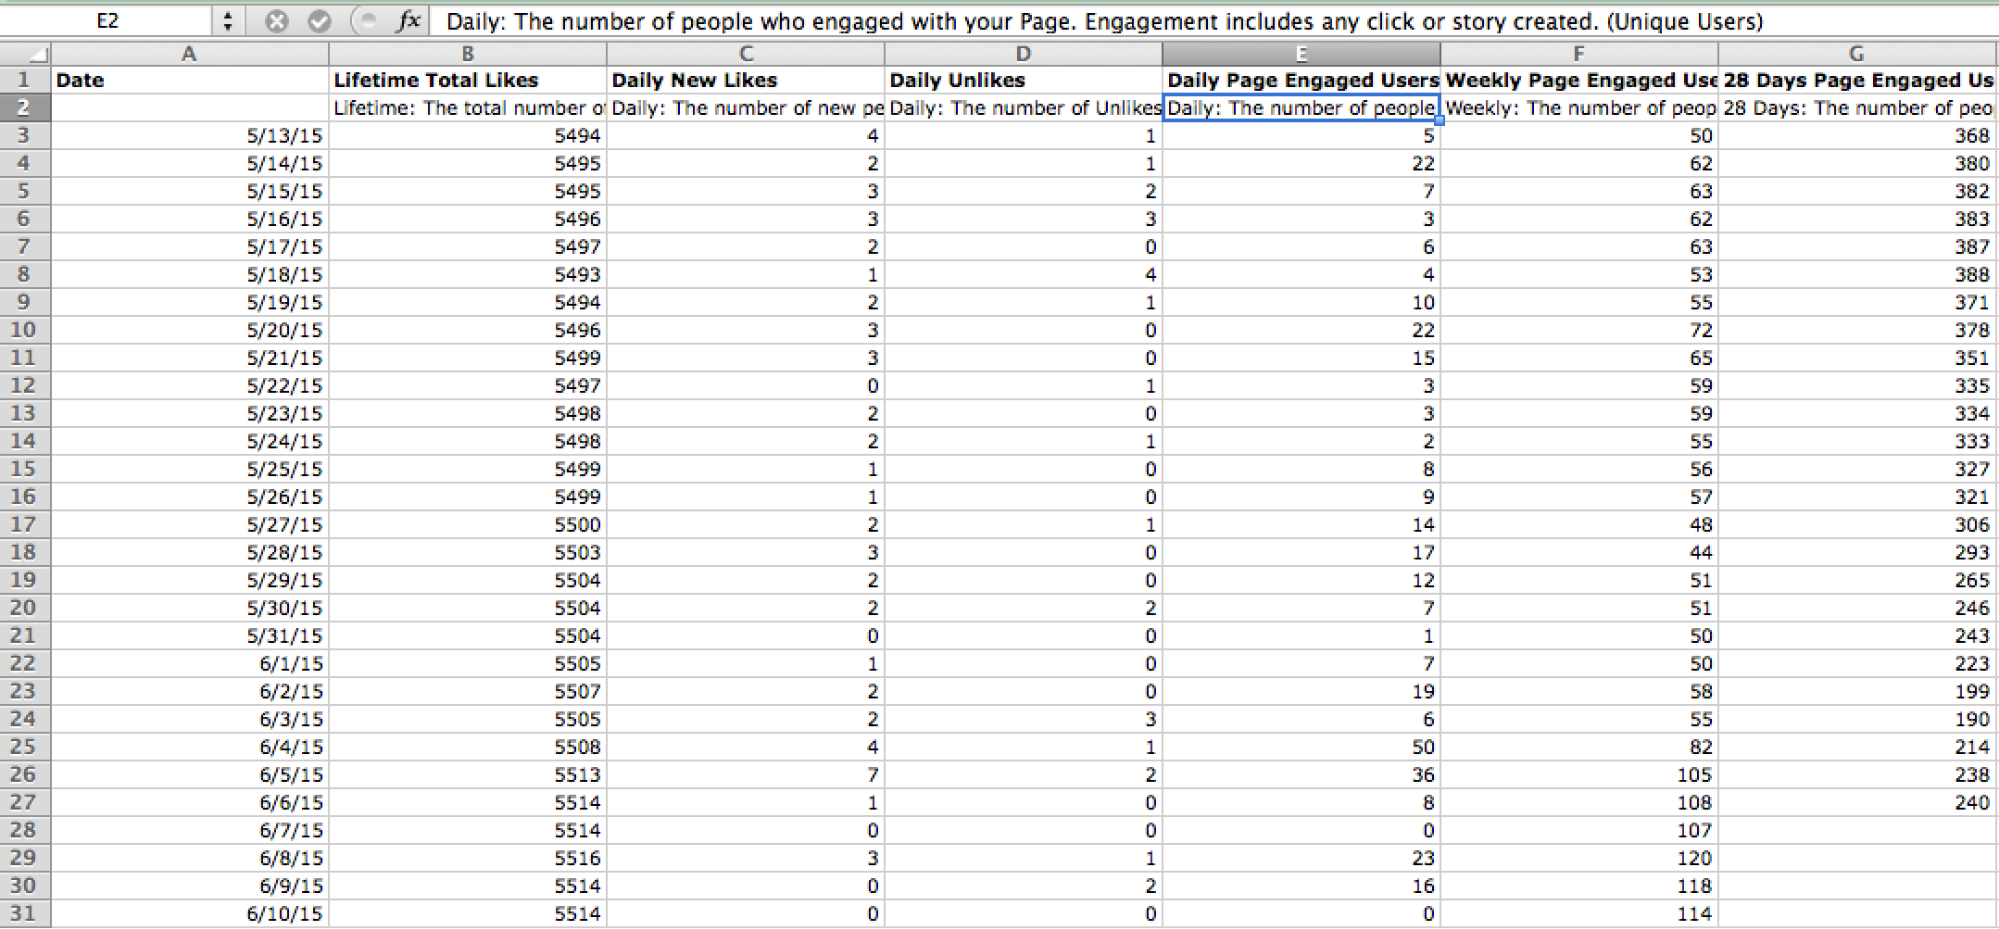
There’s a lot more to discover about Facebook and all of its tools, but these stats are a great starting point. And don’t forget that you can conduct some of your own research by keeping an eye on Facebook Insights or requesting your own Facebook Report through Sprout Social.


The post 17 Powerful Facebook Stats for Marketers and Advertisers appeared first on Sprout Social.


Posted on 5:45 PM | Categories:

30 Reasons Why Facebook Ads Isn’t Working For You


30 Reasons Why Facebook Ads Isn’t Working For You


Facebook Ads Failure


Facebook ads are almost distressingly complex, particularly if you’re just getting into advertising on the social network. Like anything with a lot of complexity, they have a lot of power behind them, if you use them properly. The problem is, with so many moving parts, there are dozens of possible points of failure. Anything and everything can go wrong, leading to lost budgets, poor performing ads or rejections. That’s why I’ve created this list of the most common reasons why your Facebook ads might not be working.


One thing to note is that these all apply only if your ads were approved but aren’t performing for some reason or another. If your ads were rejected entirely, you’ll have to go through an entirely different process to find out why. Thankfully, Facebook usually sends you an e-mail with the general reason why, and you can go from there.


Targeting Issues


Facebook Targeting Issues


These are all issues with ad targeting. I’ve found that targeting is generally the most complex and most prone-to-failure part of Facebook ads. Poor targeting can cause your entire budget to be drained in minutes from worthless clicks, or it can mean your ads are never seen. If your ads aren’t working, this is the first thing I’d check.


1. You Didn’t Exclude Clickfarm Countries


This is a pretty basic bit of geotargeting you need to do for every ad. Countries like the Philippines, Bangladesh, and Pakistan are known as clickfarm countries. This is because some of the largest and most pervasive clickfarms operate from them. Clickfarms are groups of low-paid workers that go around clicking ads and liking pages, which increases metrics for companies but can’t possibly result in a conversion. You can’t make money from clickfarm users, so ban the geographic locations they reside in.


2. You Used an Invalid Audience


Sometimes, it’s easy to use the wrong audience for the wrong ads. For example, if you’re running an ad that has a page like as an objective, you don’t want to use the audience that includes the people already liking your page. They’d see the ad, but they can’t complete the objective, so it’s worthless to try. If you try to use such an audience, Facebook will try to optimize around it, and you’ll get no exposure.


3. Your Target Audience is Too Small


If you go hog wild with targeting options, you’ll end up making your audience smaller and smaller. It used to be possible to prune things down to an audience of just one person, but that was easy to abuse, so they changed it. Now, if you apply too many targeting options, your audience will be too small and your ad won’t run.


4. You’re Targeting Disinterested Users


This is a more insidious problem because everything can look right, and your ad will run, but you won’t get the conversions you’re looking for out of your ads. It’s perfectly valid to run ads targeting middle aged men with low incomes, and Facebook won’t stop you from running an ad with those options. However, if your business is geared towards selling products to upper class women, you won’t get any sales. Know your audience to know your targeting.


5. You’re Targeting the Wrong Times


Facebook has an option for running ads, which allows you to choose specific days and times to run your ads. For example, if you know most of your users are active at 5pm on Wednesday, you can schedule your ads to run primarily during that timeslot. Be aware, however, that if you misjudge the activity level of your users, or if you have stiffer competition in those times, you’ll end up paying more for less exposure.


Image Issues


Ad Image Optimization


Another possible issue with your ads is your image. Facebook is a very graphical platform. Just look at any news feed; every other post is an image in some way, and many of them are sponsored ads. Sidebar ads are the same; they rely on an image to grab attention. I would argue that your image is more important than your copy. The copy convinces people to click, but the image gets them to look to read the copy.


6. Your Image is Too Small


This is a particular issue for sidebar ads, which have a very small piece of real estate to use. If you’re trying to condense a 1200 pixel image into the 200 pixel space you have, you lose a lot of detail. If that image was, say, a crowd shot, or a wide view of complex machinery, it will look like a mess when compressed. Some images work when scaled down, others do not. Always preview your image at small size to make sure it fits.


7. Your Image Blends In


Facebook is image-heavy, but the site design itself is blue, black, gray and white. I don’t care what your branding is or what your company design is; trying to use those colors on Facebook is a death sentence. Users are used to ignoring the Facebook system surroundings in favor of the much more garish images everywhere. If you blend in with Facebook’s colors, you’ll be ignored the same way.


8. Your Image Isn’t Attractive


This one is the most insidious of the image-related problems, and much like targeting, it’s because it’s very subjective. An image that works well for one audience might be very off-putting for another audience. You need to know your audience and their relationship with your business, so you can pick images that are appealing to them.


9. You’re Conveying the Wrong Emotion


This is a similar problem to the previous one, but it’s a specific enough issue I’d like to talk about it separately. Basically, images have an emotional tinge, and you want to pick the right emotions to match your copy. You don’t want a picture of an angry person when you’re selling a piece of software, it makes people think of frustration caused by software issues.


10. Your Image is Boring


Remember, your image is what draws people to look at your ad in the first place. If that image doesn’t have enough interesting going on with it, who is going to give it a second glance? A picture may be worth a thousand words, but there are definitely cases where one set of 1,000 words is far more interesting than another. Make sure your images are eye-catching.


Copy Issues


Facebook Ad Copy


I mentioned before that your image is possibly more important than your copy, but that’s not precisely true. They’re both very important. Your image can only do so much; you need the copy to drive home the bargain and get people to click to do whatever it is you want them to do. This is where techniques like clickbait come from, even though they’re banned by Facebook.


11. Your Headline is Boring


The opposite of clickbait is a basic headline that provides no information. Would you want to read an article titled “A Post About Facebook Ads”? Probably not. On the other hand, you’re a lot more likely to click on a title like “30 Reasons Your Facebook Ads Aren’t Working”. It’s all about the value; users know what they’re getting into. The same goes for any ad headline.


12. Your Copy Lacks a Value Proposition


Facebook doesn’t give you a lot of space in your ads to make your case, so you need to use what little you have well. It’s all about the value proposition. You need to figure out what users can get out of clicking your ad and make sure they know it’s both something they need, and something they can get by clicking.


13. You Make Dated References


This one is particularly problematic when you’re trying to reference pop culture and memes. If you’re making references to celebrity couples that no one has cared about for years, you might be making dated references. On a more common note, this crops up when you run holiday ads for days after the holiday has passed, because you didn’t set a time limit and haven’t turned them off.


14. You Have No Call to Action


“Yes, but what do I actually DO?” If your users look at your ads and can ask this question, you’re missing a call to action. Is your ad trying to get them to view your site? Are you trying to get a page like? Are you going for app engagement? Every objective has an associated call to action that you need to make.


15. Your Copy is Offensive in Some Way


This is a rare issue, and it’s the most subjective of the issues with copy listed here. A lot of offensive language is caught by Facebook and rejected, but sometimes something slips through that seems innocuous but is actually offensive. You never know what someone is going to find offensive, so try to run your copy by a few different people before you put it in motion, just in case.


Pricing Issues


Facebook Billing Methods


Issues with pricing are typically easy to resolve, but they’re not always the first place you look when something goes wrong. I would say, though, that they’re easy enough to check off the list that you should always check for them first.


16. Your Payment Method was Declined


Sometimes, a financial institution or a bug in the system will cause an issue with payment processing. If a payment is declined, either by a bank, by the balance of a prepaid card running dry, or by a Paypal account emptying, Facebook will stop your ad campaigns until a new payment method is entered an any unpaid balance is paid. It’s easy enough to do this, at least. If a bank declined a payment, call them and tell them it’s valid.


17. Your Maximum Ad Spend is Too Low


Facebook ads are generally pay per click, or at least pay per objective. This boils down to discrete numbers, even if those numbers are in pennies. Most of the time, you’ll be charged a few quarters per click, sometimes a few dollars depending on the niche. If you don’t have enough money, or if your daily cap is set too low, you’ll only get a few clicks or none at all. You can always try raising your minimum to get more traffic.


18. Your Payment is Still Pending


A pending payment is much the same as a declined payment; Facebook will cease running your ads until payment is made. How much outstanding balance is needed to reach this level? That depends on your cumulative ad spend for the month. You have a cap that starts at $25. Once you rack up $25 in ad spend, Facebook charges you and raises the cap. This cycle continues until your cap is pretty large, around $500. Any pending payment will cease the process.


19. Your Bid is Too Low to Reach Anyone


Facebook has two types of ads; premium and marketplace. Premium are more expensive, but they guarantee you views. Marketplace can save you a lot of money, but you need to bid high enough to make sure you get views. If you have five competitors and only four slots to go around, you need to out-bid at least two or three competitors to guarantee yourself a spot.


20. You’re Paying for Impressions, Not Objectives


This is very common, and is partially a symptom of poor targeting. Pay per view ads are fine, if you have the compelling copy, compelling image, and compelling offer that encourages those viewers to click and convert. If none of those happen, Facebook will happily display your ad to people who never bother to click it. You still pay, though, because it was displayed to them.


Miscellaneous Issues


Miscellaneous Facebook Issues


The remaining ten items on this list are all issues that didn’t fit in any one category. They’re all various issues that I’ve encountered while troubleshooting Facebook ads, and they can all have a dramatic negative impact on your overall ad performance. If all else fails, one of these is probably your problem.


21. Your Ads are Turned Off


Believe it or not, this is a common problem. This is because there are three levels in Facebook ads, and they all have individual off switches. The ad level, the ad set level, and the ad campaign level all can be disabled. If the ad level is on, and the campaign is on, but the set is off, the ads won’t run. Check each level and make sure it’s enabled to make sure your ads run.


22. Your Landing Page Doesn’t Convert


This isn’t an issue with Facebook ads so much as it is with your landing page. You can have very interesting ads funneling people to a page that just doesn’t look good, and doesn’t convert. You’ll have to dig into the wonderful world of conversion rate optimization to troubleshoot this problem.


23. Your Link is Broken


Facebook will test your link at the time of ad review to make sure it works. If at any point after that, your page moves or breaks, the ad runs just fine. It’s up to you to make sure the page is still visible. Furthermore, Facebook just checks to see if the link works, not what page it is; a 404 page or a redirect to your homepage is perfectly viable for ads, and Facebook won’t care. Always double-check the ad works by clicking your ad, not just by loading the page manually.


24. Your Competition is Too Strong


This one is partially mentioned above; Facebook is one of the top advertising platforms in the world. As such, a lot of people are using it to market, and that means a lot of competition for the attention of your potential users. That’s why reach is declining; more content than ever is being shown, but users have the same amount of attention as they ever have. Sometimes, your niche is just packed with competition and you’ll need to try different targeting or a higher bid if you want to be visible.


25. You’re Not Following Up on Leads


This is another off-site issue most of the time, but it can happen on Facebook as well. If you run an ad to get people to like your page, that’s fine. If your page is idle, though, that’s not fine. People don’t like to follow pages that don’t post anything. You need to follow up on the leads that ads provide, whether that means on your site, through your newsletter, or on your page itself.


26. You Don’t Have a Measurement of Value


This is a more nebulous state of failure. Sometimes, your ads are working, and they’re working perfectly. The problem is, you have no idea. You haven’t been tracking the right metrics and comparing them in the right way. Jon Loomer has a good guide for what you should be tracking, how it matters, and how you should do it.


27. You Chose the Wrong Ad Objective


Facebook ad objectives apply a level of passive optimization on the back end, that you can’t replicate with targeting or settings yourself. It’s all on Facebook’s end. Therefore, you have to pick the right objective. If you’re running an ad to get people to click through to your website and buy a product, you don’t want it shown to an audience optimized for clicking Facebook links and liking pages, but not leaving the site.


28. Your Ad Frequency is Too High


Your ad frequency is a measurement of how often the average user in your audience sees your ad. If you have an audience of 100 and every single person sees your ad exactly once, it’s a frequency of 1. That’s your ideal goalpost. If it approaches 2, that’s people seeing your ad more often than is necessary. If it’s under 1, you’re missing part of your audience and either need to increase your bid, run your ad longer, or narrow your targeting.


29. Your Ad Has Grown Stale


This can be a symptom of either a high ad frequency, or of an ad that has run too long. After a user has seen an ad, they generally don’t care to see it again. If they’ve seen it several times, it’s long since gone stale, and they don’t particularly care about it. They might even assign a negative opinion of your brand to their minds. Change up your ads, and change them frequently, for maximum viability.


30. You’re Not Testing Ad Variations


Testing is the lifeblood of a successful ad campaign. You never know when a slight change in language, a different image, or a different set of targeting options will dramatically increase your engagement rates. Always be experimenting, never stagnate.


The post 30 Reasons Why Facebook Ads Isn’t Working For You appeared first on Boostlikes.com.


Posted on 12:45 PM | Categories:

Wednesday, June 17, 2015

The 75 Most Important Social Media Acronyms


The 75 Most Important Social Media Acronyms


social media acronyms cheatsheet


Acronyms are a natural fit for social media networks. These platforms are based on short and snappy communication, so it makes sense for people to rely on abbreviations, especially for common phrases.


But understanding shorthand isn’t just important for the messages you send. There are social media acronyms that you’ll find in business meetings, in marketing or sales reports, and from your IT team. To be the best at your job, you’ll need to know all of the most common abbreviations.


This list of acronyms can help you stay fresh with the latest lingo, online and off.


Network-Specific Acronyms


To start, it’s probably most helpful to review some of the common acronyms that are tied to specific social media networks. They’re generally intuitive, but you should be sure they’re locked in your brain.


1. FB: Facebook.

2. G+: Google+.

3. IG: Instagram.

4. LI: LinkedIn.

5. YT: YouTube.


There are also a few regularly used acronyms that describe features on those networks. If you’re on Twitter in particular, these are a must-know for improving your communications among team members and with your online audience.


6. DM: A “Direct Message” is a one-on-one message sent on Twitter that is only visible to the two individuals exchanging them.

7. MT: Sometimes when you’re resharing a Tweet, you’ll alter the text. That makes it a “Modified Tweet.” That may mean shortening it to fit within the character limit or removing the poster’s handle if they have a private account.

8. PM: “Private message” is the more general term for any one-on-one communication that’s not visible to the public. It includes DMs.

9. RT: A “Retweet” is when you publish somebody else’s Tweet, in its entirety, to your own feed.social network specific list of acronyms


For Business


Business experts have always had a unique set of terminology. Many of the general terms that would come up in marketing meetings are equally useful in a social media context.


10. B2B: This “business to business” label refers to companies that are selling to other companies.

11. B2C: On the other hand, “business to consumer” designates a company that is selling to individuals.

12. CMGR: This is the abbreviation for “community manager.”

13. CMS: A “content management system” is the tool you use for editing, scheduling and publishing any written material for the web.

14. CPC: The “cost per click” is the dollar amount an advertiser pays for every person who clicks on an ad.

15. CPM: “Cost per thousand” measures an ad’s impressions rather than its clicks (as in CPC).

16. CR: The “conversion rate” is a simple equation: the number of people who take an action divided by the number who could have.

17. CTA: A “call to action” is a statement that asks the reader to do something. This is usually a specific action related to building the company’s social presence or to getting involved in a marketing push.

18. CTR: The “clickthrough rate” is a particular type of conversion rate where the action in question is clicking on a link.

19. KPI: A “key performance indicator” is a metric your team or business uses to measure success in achieving goals. For social media, this could be a measurement of engagement, conversions, shares or clicks, depending on your purpose in being on those networks.

20. PPC: “Pay per click” is a metric for advertising costs that’s the same as CPC.

21. PV: This stands for “page views.”

22. ROI: “Return on investment” measures the money you make in relation to the money you spent to make it. It’s a way of assessing the success of certain promotional or advertising efforts.

23. UGC: The term “user generated content” encompasses any written or visual material that the individuals using a platform create, from comments or blog posts, to photos or video clips.list of business acronyms for social media


The Technical Terms


These may not come up frequently in your regular water-cooler chats, but it’s useful for anybody working in social to understand some of the most relevant technical abbreviations. These cover a range of acronyms related to online business that could come up in a chat with the IT team or when dealing with a customer support ticket. In either case, you don’t want to be nodding along without knowing what’s being discussed.


24. API: An “application programming interface” is a set of rules for how pieces of software interact. Your social media management tools use the APIs of Facebook, Twitter and the other networks to post and schedule.

25. ESP: Your “email service provider” is the software used for sending emails. This can be an outside service used for email blasts to your audience or for powering your internal team communications.

26. HTML: You see these letters all the time, and they stand for “hyper text markup language.” It’s the coding language used to build all webpages.

27. ISP: Just as the ESP is the business supplying your email needs, your “Internet service provider” is the company powering your Internet service.

28. RSS: A “really simple syndication” is a feed of all posted content from a source, usually a blog.

29. SaaS: This is an abbreviation for “software as a service,” which is a subset of companies that are in the business of providing software programs.

30. SEM: “Search engine marketing” is how businesses leverage search engines for marketing purposes.

31. SEO: “Search engine optimization” is a form of SEM. It refers to the choices you make in your written content that are designed to make sure that your creations appear high in the rankings of the correct search terms.

32. TOS: “Terms of service.” Just about any online service, including social networks, has a Terms of Service that you must agree to in order to use it. Marketers will want to keep an eye out for any limitations on business activity and details about ownership, both of your content and your data.

33. UI: The “user interface” is the display that a person uses to control a tool.

34. UX: The “user experience” is a person’s response and reaction to taking actions within a tool.list of technical acronyms for social media


Just for Fun


Many of these acronyms crossed over into social media from texting or from online shorthand used in forums. Some of them have been bandied around the Internet for years, but others are more modern inventions. You’ll most likely find these in the public posts made and shared by your followers, or in their comments on your social content. Some of them also get turned into popular hashtags that individuals and brands alike can take advantage of.


35. AFAIK: Stands for “as far as I know.”

36. AMA: Stands for “ask me anything.” Often used to signal an open Q&A opportunity on a social channel.

37. BAE: This abbreviation means “before anyone else,” and is one of the more recent creations. Typically it refers to a person’s significant other, but could be a very close friend as well.

38. BFF: A throwback to childhood in the 80’s and 90’s, this still stands for “best friends forever.”

39. BRB: “Be right back.” This comes up most often in the context of real-time messaging or chat services.

40. BTW: Stands for “by the way.”

41. FBO: Stands for “Facebook official.” This most often refers to making a public announcement of a life development, such as a new job or new relationship, on Facebook to your entire social audience.

42. FF: The “follow Friday” trend began as a Twitter hashtag for recommending people who merit attention on social. These days, most users don’t make this a weekly update, but save it for giving a signal boost to especially interesting or important social profiles.

43. FOMO: Stands for “fear of missing out.”

44. FTW: This acronym of “for the win” initiated in the gaming world, but has become a cry of victory or success for all.

45. FYI: “For your information.” Another classic that’s still in frequent rotation.

46. GTG: “Got to go” can end a conversation.

47. ICYMI: “In case you missed it” most frequently is used when sharing content that is not current. That could be a news item from a few days prior or an evergreen blog post that you want to return to circulation.

48. IDC: Stands for “I don’t care.”

49. IDK: Stands for “I don’t know.”

50. ILY: Stands for “I love you.”

51. IMHO: This acronym means “in my humble opinion.”

52. IMO: A slightly different take, this means simply “in my opinion.”

53. IRL: This acronym means “in real life,” and is meant to distinguish between people’s online and offline lives.

54. JK: This phrase is “just kidding,” and can be helpful in conveying a light-hearted tone when there’s a possibility for a statement to be misconstrued.

55. LMAO: Stands for “laughing my a** off.” Not always the right phrase for a business context, but makes it just as necessary to know this acronym when you see it.

56. LMK: Stands for “let me know.”

57. LOL: A well-used phrase from the beginning of online chat culture, this means “laughing out loud.”

58. NBD: Stands for “no big deal.”

59. NM: Stands for “not much.”

60. NVM: Stands for “never mind.”

61. NSFW: The label “not safe for work” usually designates material that is violent, sexual or otherwise inappropriate for a professional setting.

62. OH: Stands for “overheard.” Generally used as context for quotes.

63. OMG: Stands for “oh my god” or “oh my gosh.”

64. OMW: Stands for “on my way.”

65. PODT: Commonly used as a hashtag on image-centric networks, this stands for “photo of the day.”

66. PPL: This is shorthand for “people.”

67. QOTD: Another frequent hashtag, this one means “quote of the day.”

68. ROFL: A close relative of LOL and LMAO, this acronym is “rolling on the floor laughing.”

69. SMH: This stands for “shaking my head” and is most frequently used to express shock or dismay.

70. TBH: Stands for “to be honest.”

71. TBT: If you’re sharing an old photo, you’ll most likely want to use the hashtag for “throwback Thursday.” Just make sure you post on the right day of the week!

72. TIL: Stands for “today I learned.”

73. TL;DR: This unusual acronym means “too long; didn’t read.”

74. WTF: Another salty shorthand, this stands for “what the f***.”

75. YOLO: The phrase originated in a song by rapper Drake, but the acronym of “you only live once” has also caught on in social communication.list of fun acronyms for social media


list of social media acronyms cheatsheet


The post The 75 Most Important Social Media Acronyms appeared first on Sprout Social.


Posted on 12:47 PM | Categories:

Tuesday, June 16, 2015

All of the Social Media Metrics That Matter


All of the Social Media Metrics That Matter


social media metrics that matter


Did you know that when it comes to social media metrics, there are hundreds that you could be analyzing? But the real question is, do you know where to find them, and are they all necessary for your business. In this post, we’re going to look at the metrics you can gather from the top social networks and which ones matter most for your business.


Official Social Media Metrics


First, let’s look at the metrics you can get directly from the top social networks. Here’s how you find them and what you can learn from them.


Facebook Insights


Facebook offers the most comprehensive metrics for business pages. You can start by going to the Platform Insights page to see a list of all of your Facebook Pages currently tracking metrics.


facebook metrics insights overview screenshot


When you click on the Page you want to analyze, you will be taken to that Page’s insights. Here, you will find an overview of your most important metrics, followed by detailed sections on your Likes, reach, visits, posts, and people.


The overview starts with your Page’s main metrics, including the following.


  • Page Likes: Total Pages Likes is number of unique people who like your Page. New Page Likes shows the number of new Likes your Page received during the last seven days, compared with the previous seven-day period.

  • Post Reach: Total Reach is the number of unique people who have seen any content associated with your Page, including ads, during the last seven days. Post Reach shows the number of unique people who have seen your Page posts.

  • Engagement: People Engaged is the number of unique people who have clicked, Liked, commented on or shared your posts during the last seven days. Likes, Comments, Shares and Post Clicks show the totals for these actions during the last week.


facebook-metrics-engagement-screenshot


Next, you will see an overview of the engagement on the last five posts to your Facebook Page. These metrics include the following.


  • Reach: Post reach is the number of people who have seen your post. Your post counts as reaching someone when it’s shown in News Feed. Figures are for the first 28 days after a post was created and include people viewing your post on desktop and mobile.

  • Engagement: People engaged is the number of unique people who’ve clicked, Liked, commented on or shared your Page posts. In the Overview section of your Page Insights, you can see People Engaged for the last seven days.


facebook metrics recent posts screenshot


At the bottom of the Overview page, you will find metrics for Pages you watch, such as your competitor’s Facebook Pages. Metrics include the Page Likes and engagement for Page posts.


facebook metrics pages to watch screenshot


In the Likes section, you will find your net Likes, which combines the following metrics.


  • Unlikes: Number of people who have unliked your Page.

  • Organic Likes: Number of people who have Liked your Page not as a result of a Facebook Ad campaign.

  • Paid Likes: Number of people who have Liked your Page as a result of a Facebook Ad campaign.


facebook metrics net likes screenshot


Beneath that, you will find a chart showing the source of your Likes. Included are the number of Likes you receive on your Facebook Page itself, from related Page suggestions on other Pages, posts that other people make on your Page and Likes from mobile users.


facebook metrics like sources screenshot


On the Reach tab, you can review two different sets of metrics that affect your reach. After a graph showing your overall organic versus paid reach, you will see a graph showing your overall post Likes, Comments, and Shares. If these metrics increase, you will reach more people organically.


facebook metrics likes comments shares screenshot


Next, you will see how many times people on Facebook hide your post, report posts as spam or unlike your Page. If these metrics increase, you will reach less people organically.


facebook metrics hide posts screenshot


On the Visits tab, you will see metrics for how many people visit specific areas on your Page. These metrics can help you determine if your custom apps are getting traffic and if you need to update specific tabs more often.


facebook metrics page visits screenshot


On the Posts tab, you will see detailed metrics for your Facebook Page posts. By default, you will start by viewing your post’s organic versus paid reach and the post clicks, Likes, comments and shares. Note that the Post Clicks metric means any click on your Facebook post itself and not just clicks from your post to a website link.


facebook metrics published posts screenshot


You can use the first drop-down to switch from seeing your organic versus paid reach to organic versus paid impressions. Note the difference in the reach versus impressions metrics.


  • Impressions: The number of times a post from your Page is displayed, whether the post is clicked or not. People may see multiple impressions of the same post. For example, someone might see a Page update in News Feed once, and then a second time if their friend shares it.

  • Reach: The number of people who received impressions of a Page post. Reach might be less than impressions since one person can see multiple impressions.


facebook metrics organic paid reach screenshot


You can use the second drop-down to switch from seeing post clicks, Likes, comments and shares to seeing only Likes, comments and shares; post hides, spam reports and unlikes; or engagement rate percentage. The latter is defined as follows.


  • Engagement Rate Percentage: Engagement rate is the percentage of people who saw a post that Liked, shared, clicked or commented on it.


facebook metrics post clicks screenshot


On the People tab, you will find a breakdown of demographic metrics for your fans, the people you’ve reached with your Page posts and the people who have engaged with your Page posts. This information can be utilized to ensure that you are getting the right fans for your business and to create content that will appeal to your fans, those you reach and those you engage.


facebook metrics fan insights screenshot


If those aren’t enough metrics for you, you can use the Export button at the top right of your Insights reports to export additional data about your Page, posts and videos uploaded directly to Facebook. These have raw data about your Page’s activity. What is helpful is that each metric is defined within the spreadsheet.


facebook metrics raw data export


Those who upload video will especially love the in-depth video statistics, such as how often a video was viewed for three seconds, 30 seconds or 95% of the total video length.


For those who would prefer a simpler summary of their Facebook Insights, Sprout Social provides one simple report. First, you have the overall Page Likes, impressions and demographics.


sprout social metrics facebook report screenshot


Then you have an overview look at when people are sharing your content and how.


sprout social metrics share data screenshot


Finally, you have a simpler look at how people engage with specific posts on your Facebook Page.


sprout social metrics content breakdown screenshot


This gives you the vital information you need about your Facebook Page in one report, versus in tab after tab.


Twitter Analytics


While not as detailed as Facebook, Twitter offers its own analytics for all account users. When you arrive at your analytics dashboard, you will be greeted by a 28-day summary of metrics and highlights for your activity by month. Included are the following metrics.


  • Tweets: The number of Tweets you’ve posted to your account.

  • Tweet Impressions: The number of people your Tweets have been seen by.

  • Profile Visits: The number of people who have visited your profile.

  • Mentions: The number of times your @username has been mentioned by others.

  • Followers: The number of followers on your Twitter account.

  • Tweets Linking to you: The number of Tweets attributed to you in Twitter Cards with URLs.


twitter metrics overview screenshot


On the Tweets tab, you will see a 28-day summary of metrics for the Tweets you’ve shared. These metrics include the following.


  • Engagement Rate: The number of total link clicks, Retweets, favorites, and replies your Tweets receive divided by the number of impressions.

  • Link Clicks: The number of times links within your Tweets were clicked. This includes links to hashtags and other users mentioned in your Tweets.

  • Retweets: The number of times your Tweets were retweeted by others.

  • Favorites: The number of times your Tweets were favorited by others.

  • Replies: The number of times people replied to your Tweets.


twitter metrics overview 2 screenshot


You can click on any Tweet on this screen to see detailed metrics for the it. Included in these metrics, you will find additional data with an explanation of each.


twitter metrics tweet details screenshot


On the Followers tab, you will get a detailed breakdown of demographics, lifestyle, consumer behavior and mobile information about your followers.


twitter metrics followers screenshot


For those who would prefer a simpler summary of their Twitter analytics, Sprout Social provides one simple report. In a quick glance, you can see your main metrics, follower demographics and publishing statistics.


sprout social media metrics screenshot


Google+ Insights


Google+ does not offer many metrics for its Pages. If you visit your Page’s Dashboard and click on the Manage Your Page button, you will find an overview of your most important metrics plus a link to your Google+ Page Insights.


google plus metrics overview screenshot


Inside, you will find three sections of data. The first is the Visibility section, which shows your total views, broken down by number of pageviews, post views and photo views.


google plus metrics visibility screenshot


In the Engagement section, you will see metrics about the posts to your Google+ page. These include total actions, +1’s, comments and shares. Beneath the detailed metrics for your posts, you will see average actions by post type.


google plus metrics engagement metrics


In the Audience section, you get a quick demographics overview of your Page followers.


google plus metrics audience demographics screenshot


LinkedIn Analytics


When you visit your LinkedIn Company Page you can click on the Analytics tab to learn more about your post performance and audience, all in one page. First, you will see metrics for posts made by your Company Page. These metrics include the following.


  • Impressions: The number of times the update was shown to LinkedIn members.

  • Clicks: The number of clicks on your content, company name or logo.

  • Interactions: The number of likes, comments and shares on your update.

  • Followers: The number of followers you acquired when sponsoring an update.

  • Engagement: The number of interactions divided by number of impressions.


linkedin metrics overview screenshot


Next, you will see information about your followers and how you compare to similar companies.


linkedin metrics follower demographics screenshot


Finally, you will see some metrics for your number of page views, unique visitors and visitor demographics. You can use the drop-down to switch between seniority, industry, company size and function.


linkedin metrics visitors screenshot


Pinterest Analytics


If you have a business account on Pinterest, you can access Pinterest analytics to learn more about your profile activity, audience and Pins. You will start on the Overview screen where you can see key metrics for your profile, audience, activity from your domain and most popular Pins.


pinterest metrics overview screenshot


In the Your Pinterest Profile section, you will see detailed metrics for your profile’s impressions, daily viewers and Pins. You can use the tabs at the top of the report to see top Pins based on number of impressions, Repins, clicks and all-time favorites.


pinterest metrics impressions screenshot


In the Your Audience section, you can see metrics for your average monthly viewers, average monthly engaged and specific demographics and interests.


pinterest metrics demographics screenshot


In the Activity from your domain section, you can see pinning activity from the website you have verified for your page using the Pin It button. You can use the tabs at the top to see top pins from your domain based on impressions, repins, clicks, and all-time favorites.


pinterest metrics domain impressions screenshot


Google Analytics Metrics


Now that you know what kind of metrics you can get out of the top social media networks, let’s discuss the most crucial metrics for your business. Using Google Analytics goals, you can learn more about conversions on your website, such as product sales, lead submissions, and email subscriptions. Combine your goals with the built-in social media reports within Google Analytics, and you can find out which social networks are best for your business.


Under the Acquisition section, you will find a few useful social media reports to help you determine which social networks drive traffic and customers to your website. In the Social Overview, you will get a quick look at the top social networks driving traffic to your website and the total value of the traffic you have received.


google analytics social value screenshot


Under Social Referrals, you will get a more detailed breakdown of the following metrics based on social network referral traffic.


  • Sessions: The periods of time when a user is active on your website.

  • Pageviews: Instances of a page being loaded (or reloaded) in a browser.

  • Avg. Session Duration: The average length of sessions on your website.

  • Pages / Session: The average number of pages viewed per session.


google analytics social referrals screenshot


In the Social Conversions report, you will see which social networks specifically lead to conversions on your website, along with dollar values (assuming you set your Google Analytics goal up with a specific dollar value per conversion).


google analytics social conversions screenshot


These reports can help you determine where to focus your energy when it comes to specific social media networks. More than tracking followers and engagement, they will show you which networks ultimately help your bottom line.


The post All of the Social Media Metrics That Matter appeared first on Sprout Social.


Posted on 12:01 PM | Categories: